
I'm doing an area graph for the local branch of Future In Our Hands
( Framtiden i Våre Hender, Bergen .no » ). We use data from the Institute of Marine Research (IMR) to set focus on the grim state of the coastal cod north of 62°N.
IMR seem concerned about the population of Norwegian coastal cod, but states that there are difficulties gathering correct data due to illegal fishing activity.
They choose however to present the data in the following bar/line chart – with this approach they conceal some of the information (no matter how fuzzy the reported numbers are):
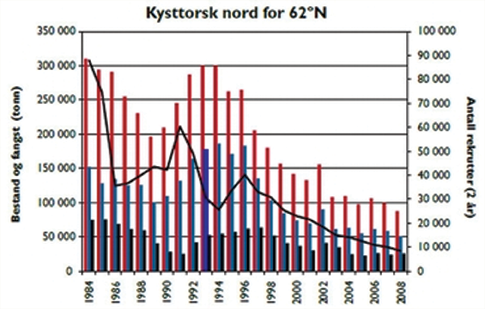
• Population (red bars)
• Spawning stock (dark blue bars)
• Fishing (black bars)
• Recruitement (black line) of Norwegian coastal cod, 1984–2008
X-axis on your left; population, spawning stock and captured fish in tons (counting from 0 upward to 350K (!). X-axis to your right; recruitment, 2 year old fish (counting from 0 upwards to 100K (!).
Source:www.imr.no/, 17th of March – 2011
If you're not careful when looking at the chart, you might find fraudulent comfort in the visual cue that the black line always stays higher than the black bars – giving the impression that the amount of recruitment (the black line) always stays higher when superimposed with the amount of captured fish (the black bars).
This is a false impression and arises because of the use of multiple values in the x-axes: One showing the amount from 0 to 350K, the second showing the amount from 0 to 100K.
Without beeing too melodramatic I guess the reason is a duplex; an error both in the software used (giving the option of double x-axis) and that of rotten hardware (human beings and their agendas ;).
By removing the double valued x-axes I dare say you'll get a more accurate and honest display (that's always the purpose, right?!):
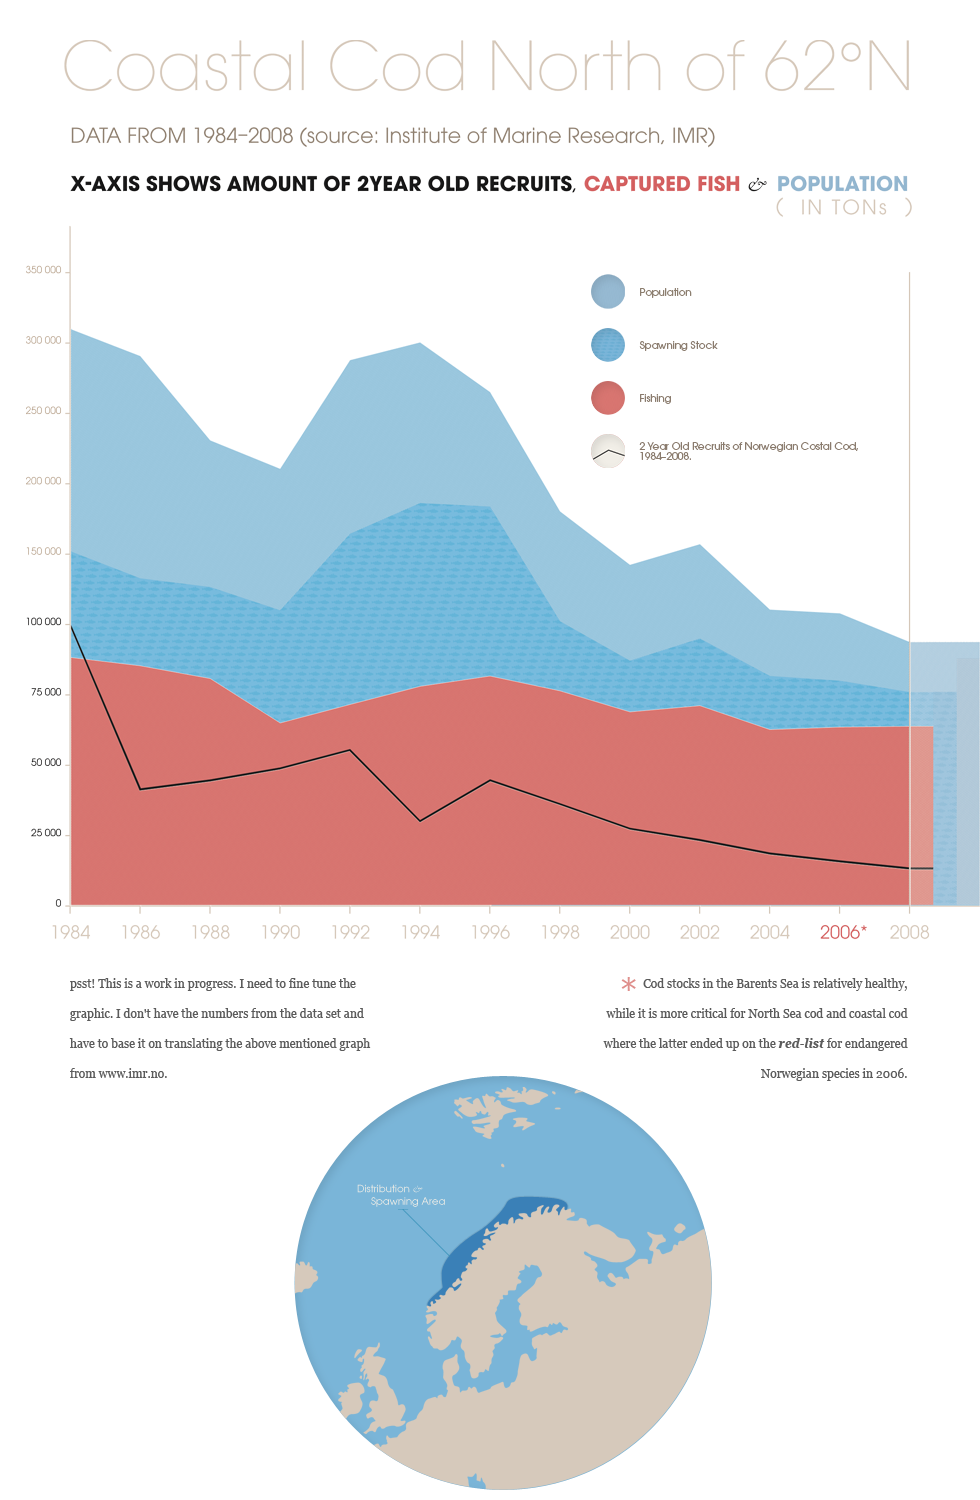
Now the plot thickens; these creatures live and do their spawning in the same areas that some of the Norwegian politicians and the Oil Industry wants the drill for oil & gas.
“I am very pleased that we have presented a sound, up-to-date management plan for the Barents Sea–Lofoten area. The waters off the Lofoten and Vesterålen Islands and Senja are considered to be some of the most valuable areas along the coast. No impact assessments will be carried out here, but we will build up more knowledge. All in all, we have found a good balance between environmental considerations and the interests of the petroleum industry,” said Mr Solheim.Source: government.no
 2011 - 2012